Going from this:
[17/May/2018:14:19:02 +0000] someclient.production.gw.apicast.io:8080 10.1.13.3:36054 "GET /?user_key=XXXXXXXXXXXXXXXXXX HTTP/1.1" 200 747 (0.100) 0.1
[17/May/2018:14:19:12 +0000] someclient.production.gw.apicast.io:8080 10.1.5.3:33492 "GET /?user_key=XXXXXXXXXXXXXXXXXX HTTP/1.1" 200 746 (0.000) 0
[17/May/2018:14:19:27 +0000] someclient.production.gw.apicast.io:8080 10.1.13.3:36874 "GET /?user_key=XXXXXXXXXXXXXXXXXX HTTP/1.1" 200 747 (0.100) 0.1
[17/May/2018:14:19:37 +0000] someclient.production.gw.apicast.io:8080 10.1.5.3:34364 "GET /?user_key=XXXXXXXXXXXXXXXXXX HTTP/1.1" 200 746 (0.000) 0
[17/May/2018:14:20:17 +0000] someclient.production.gw.apicast.io:8080 10.1.13.3:38518 "GET /?user_key=XXXXXXXXXXXXXXXXXX HTTP/1.1" 200 747 (0.100) 0
[17/May/2018:14:20:32 +0000] someclient.production.gw.apicast.io:8080 10.1.5.3:36206 "GET /?user_key=XXXXXXXXXXXXXXXXXX HTTP/1.1" 200 746 (0.000) 0
[17/May/2018:14:20:37 +0000] someclient.production.gw.apicast.io:8080 10.1.13.3:39170 "GET /?user_key=XXXXXXXXXXXXXXXXXX HTTP/1.1" 200 747 (0.100) 0.1
[17/May/2018:14:20:47 +0000] someclient.production.gw.apicast.io:8080 10.1.5.3:36686 "GET /?user_key=XXXXXXXXXXXXXXXXXX HTTP/1.1" 200 746 (0.100) 0.1
[17/May/2018:14:21:02 +0000] someclient.production.gw.apicast.io:8080 10.1.5.3:37192 "GET /?user_key=XXXXXXXXXXXXXXXXXX HTTP/1.1" 200 746 (0.100) 0.1
[17/May/2018:14:21:22 +0000] someclient.production.gw.apicast.io:8080 10.1.5.3:37826 "GET /?user_key=XXXXXXXXXXXXXXXXXX HTTP/1.1" 200 746 (0.100) 0.1
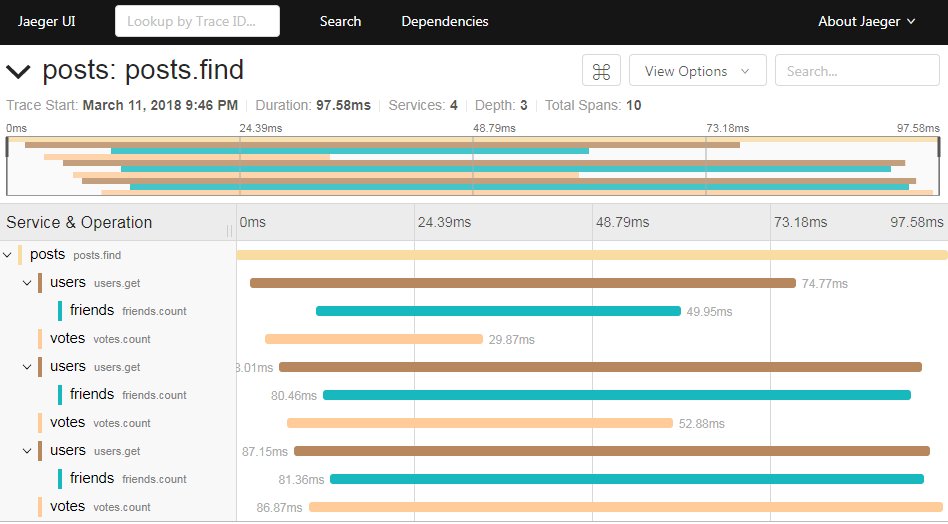
To:
Let’s start by explaining what APIcast, OpenTracing and Jaeger are, and how we improved Observability of our user systems by embracing them.
TL;DR: If you know what APIcast, Jaeger & OpenTracing are, you should jump to the last section :)
APIcast
APIcast (https://github.com/3scale/apicast) is an Opensource API Gateway with it’s main focus on high performance and extensibility, is part of the Redhat 3scale API Management solution, and is used by hundreds of companies around the world to expose their APIs in a secure and controlled way.
It’s based on Openresty, which is a full-fledged web platform that integrates the standard Nginx core, LuaJIT and Lua Libraries with 3rd-party Nginx modules. So we have the performance and robustness of nginx with an easy way to extend/change it’s functionallity by using LUA.
Improving Observability
APIcast is being deployed in multiple scenarios, but more and more, our users are deploying APIcast as the API Gateway of big and complex microservices deployments.
As you can imagine, we are talking about hundreds of microservices, interacting with each other, and each external requests ends up creating several requests between services. This raises new challenges, and one of them is: “Observability”
- Why this request was so slow?
- Which service is creating those latency peaks?
- Which services are interacting when a user hits this endpoint?
- Why the request failed?
- Who initiated this request?
- …
Right now, answering those questions is slow and complex, as the users start debuging via logs and trying to correlate everything, so we need to we need to start looking at how microservices are monitored, and distributed tracing shows up as the pattern that help us to get insight on what is going on inside the system.
What is required to add distributed tracing to our microservice deployment?
- Each external requests should have a unique request ID attached, usually via a HTTP header
- Each service should forward the request ID to other services
- Each service should output the requets ID in the logs
- Each service should record additional information, like start and end time of the request.
- Logs will need to be aggregated somewhere, and provide a way to parse via HTTP request ID.
For APIcast, that is simple, attach a unique ID as a HTTP Header and we are done…
But the user will need to define a log format across all the services, what parameters to be stored in the log, the http header to use, how to capture the start/end time of each requests…correlate them, check how to do that in third party applications, try to modify those…
So we ask ourselves, Shouldn’t exists a “standard” way of doing this?
And that’s where OpenTracing comes into scene.
OpenTracing
OpenTracing (http://opentracing.io) offers consistent, vendor-neutral APIs, Opensource libraries and documentation for developers to instrument and add different tracing implementations into their applications.
Currently the OpenTracing project provides libraries for the following languages:
- Go
- Python
- Javascript
- Java
- C#
- Objective-C
- C++
- Ruby
- PHP
And there’s a huge community pushing new contributions, check: https://github.com/opentracing-contrib.
Once you have instrumented your application by adding the OpenTracing libraries, you will need to choose the tracing implementation, those are the supported one:
- Jaeger
- Appdash
- LightStep
- Hawkular
- Instana
- Apache SkyWalking
- inspectIT
- stagemonitor
- Datadog
We decided to go with Jaeger, as it is part of the CNF, has Openshift ready deployments https://github.com/jaegertracing/jaeger-openshift, and Red Hat is contributing to it.
Tracer: Jaeger
Jaeger is a distributed tracing system developed by Uber Technologies, inspired by Dapper and Openzipkin. It supports multiple storage backends, is OpenTracing native and includes a modern web UI and it’s designed for performance.

As you can see in the diagram, the main components are:
- Jaeger-client: The jaeger library that creates the spans.
- Jaeger-agent: Reports traces from the jaeger-client to jaeger-collector.
- Jaeger-collector: Centralizes traces from jaeger-agents and saves them into a storage backend.
- Jaeger-query: Retrieves traces from a datastore
- Jaeger-ui: Jaeger UI, uses jaeger-query to get retrieve traces.
Jaeger supports Adaptative sampling, which means that we can tune how many traces are sampled by choosing the proper sampler:
- Constant: All traces.
- Probabilistic: can be adjusted from 0% to 100%
- Rate Limiting: How many traces per second, for ex: 2.0 (only 2 traces per second.)
- Remote: Checks with the jaeger agent which sampler to use for this service.
If you want to know more about Jaeger, visit: https://www.jaegertracing.io
Enabling OpenTracing with Jaeger in APIcast
We packaged all the OpenTracing libraries, and the Jaeger Tracer library in the base container image of APIcast, s2i-openresty this image is “source-to-image” enabled, so you can use it as the base of your own projects.
We will use OpenShift, and the container image of APIcast (https://quay.io/repository/3scale/apicast), so we assume you have APIcast deployed on top of Openshift and your 3scale account created, if that’s not the case, there’s an amazing guide to get you up & running in no time here: Using 3scale API Gateway on Red Hat OpenShift
APIcast OpenTracing support is enabled/disabled using ENV vars:
-
OPENTRACING_TRACER: Which Tracer implementation to use, right now, only
Jaegeris available. -
OPENTRACING_CONFIG: Each tracer has a default configuration file, you can see an example here: jaeger.example.json
-
OPENTRACING_HEADER_FORWARD: By default, uses
uber-trace-id, if your OpenTracing has a different configuration, you will need to change this value, if not, ignore it.
In the first place let’s deploy the Jager All-In-One template, this is not really meant for production environments, but for demo purposes it will be enough.
- Install the Jaeger all-in-one in the current namespace:
oc process -f https://raw.githubusercontent.com/jaegertracing/jaeger-openshift/master/all-in-one/jaeger-all-in-one-template.yml | oc create -f -
For more info related to deploying jaeger in a production environment: https://github.com/jaegertracing/jaeger-openshift#production-setup
- Access the Jaeger-UI:
> oc get route

NAME           HOST/PORT                                 PATH      SERVICES       PORT         TERMINATION   WILDCARD
apicast        apicast.127.0.0.1.nip.io                            apicast        proxy        edge          None
jaeger-query   jaeger-query-myproject.127.0.0.1.nip.io             jaeger-query   query-http   edge/Allow    None
In my case, the url is https://jaeger-query-myproject.127.0.0.1.nip.io
You should be greeted by this menacing looking gopher:
- Now, let’s create our own Jaeger configuration file:
cat <<EOF >jaeger_config.json
 {
    "service_name": "apicast",
    "disabled": false,
    "sampler": {
      "type": "const",
      "param": 1
    },
    "reporter": {
      "queueSize": 100,
      "bufferFlushInterval": 10,
      "logSpans": false,
      "localAgentHostPort": "jaeger-agent:6831"
    },
    "headers": {
      "jaegerDebugHeader": "debug-id",
      "jaegerBaggageHeader": "baggage",
      "TraceContextHeaderName": "uber-trace-id",
      "traceBaggageHeaderPrefix": "testctx-"
    },
    "baggage_restrictions": {
        "denyBaggageOnInitializationFailure": false,
        "hostPort": "127.0.0.1:5778",
        "refreshInterval": 60
    }
 }
EOF
This creates a new file: jaeger_config.json
- Let’s review the important bits:
Sampler configuration:
"sampler": {
  "type": "const",
  "param": 1
}
This defines the sampler as [const]ant, with a param of “1”, the means, it will sample all the requests.
Reporter:
"reporter": {
  "queueSize": 100,
  "bufferFlushInterval": 10,
  "logSpans": false,
  "localAgentHostPort": "jaeger-agent:6831"
}
Max queue of 100 requests and flush interval of 10s, we are not outputting the spans to the log, and the agent host is expected to be running at “jaeger-agent:6831”.
!! You will need to tune those values if your service is doing more than 100 requests in less than 10s, either increase the queueSize, or decrease the bufferFlushInterval.
Headers:
"headers": {
  "jaegerDebugHeader": "debug-id",
  "jaegerBaggageHeader": "baggage",
  "TraceContextHeaderName": "uber-trace-id",
  "traceBaggageHeaderPrefix": "testctx-"
}
The most important one for now, is the TraceContextHeaderName, we are going to use the default value of uber-trace-id. This is the HTTP header we need to forward in all our services to propagate the span information and be able to correlate them.
- Let’s create a ConfigMap from our jaeger configuration so we can mount it inside APIcast:
oc create configmap jaeger-config --from-file=jaeger.json
- Mount the ConfigMap into APIcast.
oc volume dc/apicast --add -m /tmp/jaeger/ --configmap-name jaeger-config
This will trigger a redeployment of APIcast, now all the PODs will have our new configuration, available at /tmp/jaeger/jaeger_config.json.
- Let’s enable OpenTracing and Jaeger with our custom configuration.
oc env deploymentConfig/apicast OPENTRACING_TRACER=jaeger OPENTRACING_CONFIG=/tmp/jaeger/jaeger_config.json
This will trigger the redeployment of APIcast, and we should go to our jaeger-UI to see if it’s populating with APIcast data.

Current limitations
As you know, Openresty is Nginx + luaJIT, and right now, we only get OpenTracing information for the “Nginx” part of it, there aren’t any OpenTracing libraries for lua.
We are working on being able to use the OpenTracing C++ libraries from LUA, so we can create spans directly from it, and gain even more visibility into APIcast internals. For example, this could help debug if that custom policy you just installed is making things slowers.
We are Hiring!
If you are interested in this kind of projects, we are hiring! :)